Scodoc
A student tracking database, modeled from scratch and reported through Excel and Power BI.
Context
SAÉ 2.04 of the BUT in Computer Science, “Using a database”. The brief was to design a database managing students, their groups, modules, assessments and grades, then to draw analyses from it.
Team and my role
Group project, 3 people.
I co-designed the conceptual and logical models, wrote the reports, co-wrote the SQL queries and Excel calculations, and created the Power BI report.
Approach
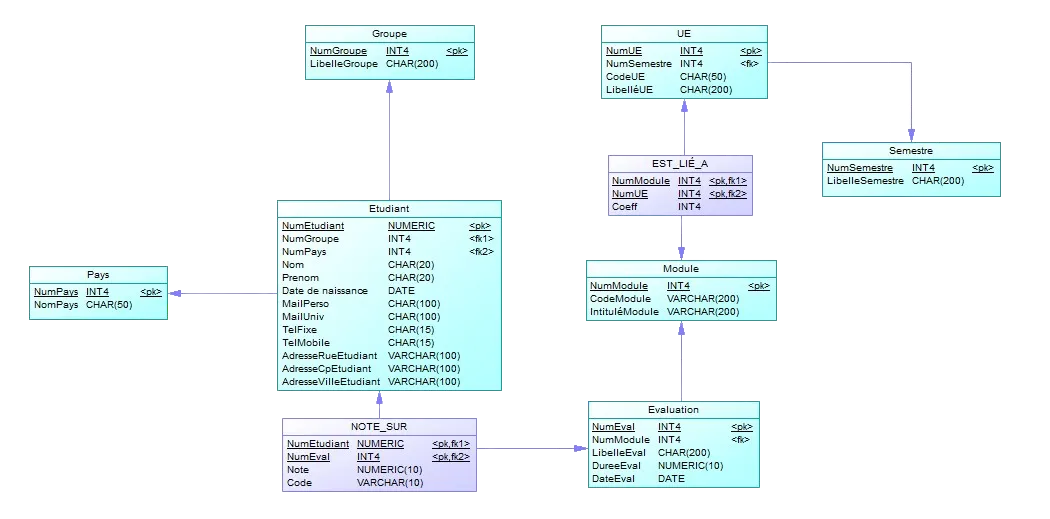
- Design: requirements document, then conceptual and logical models in UML.
- Database: PostgreSQL script to create the schema and insert the data.
- Queries: SQL queries answering tracking questions, such as students with no grade for an assessment.
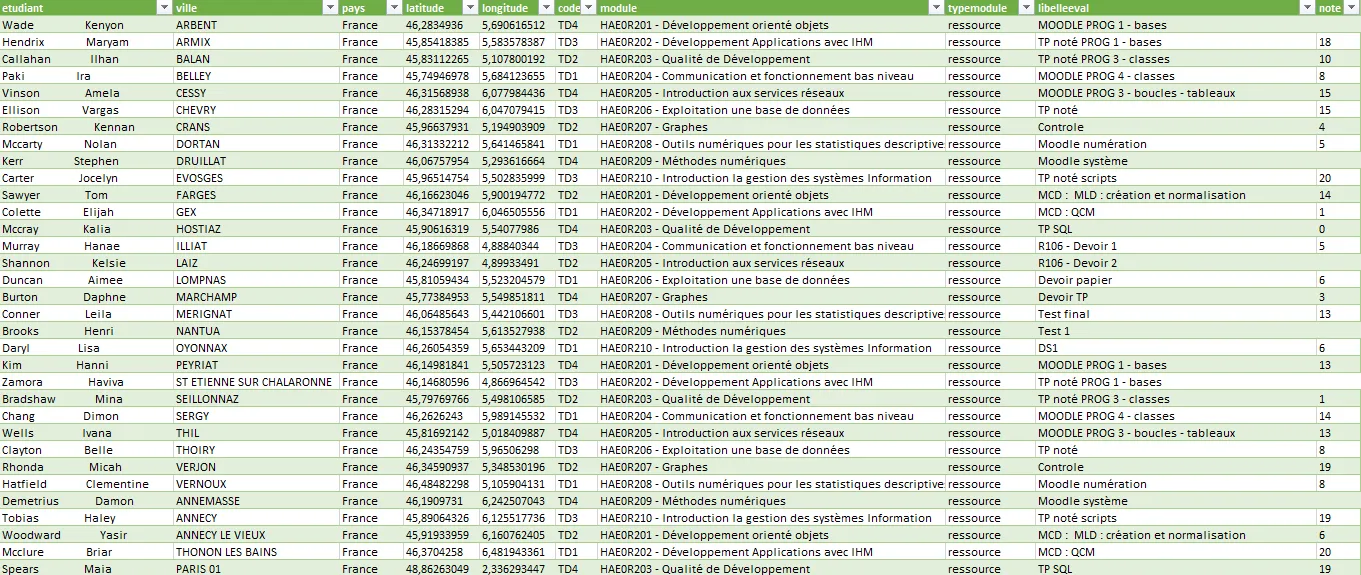
- Analysis: SQL view combining grades, students, modules and groups, imported into Excel for calculations.
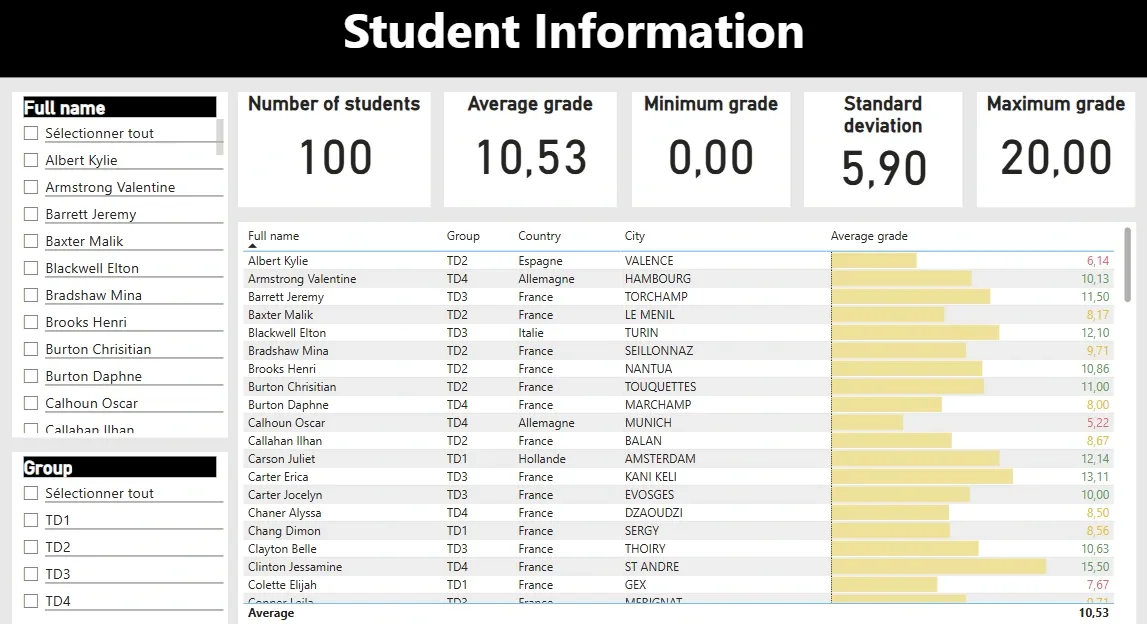
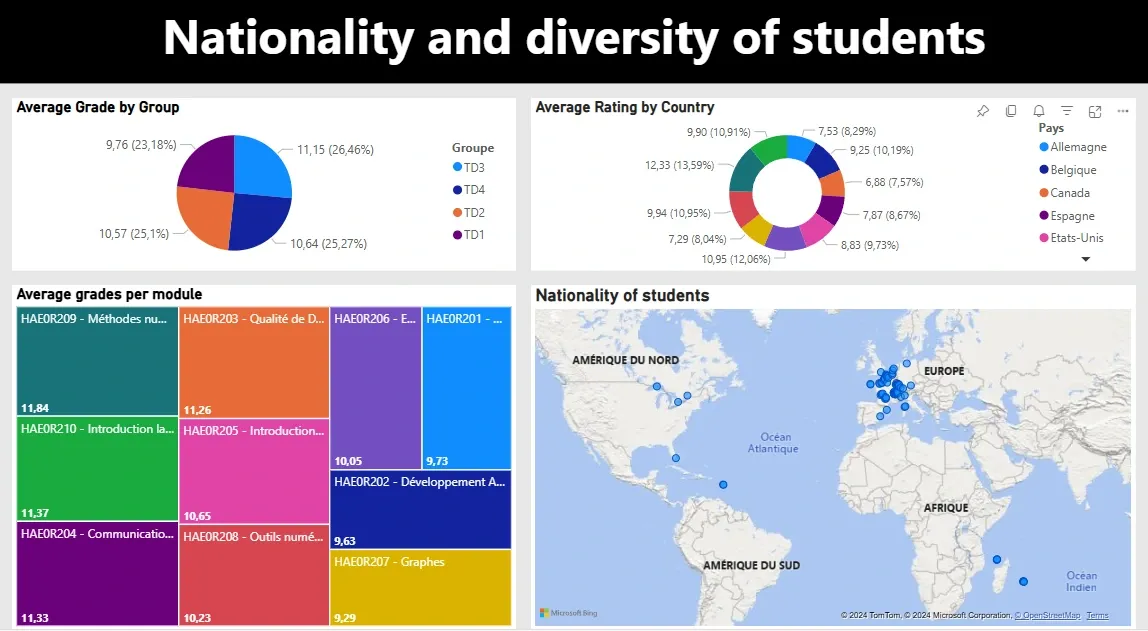
- Visualization: Power BI report built on this view, with a tracking page and a map page.
Visuals
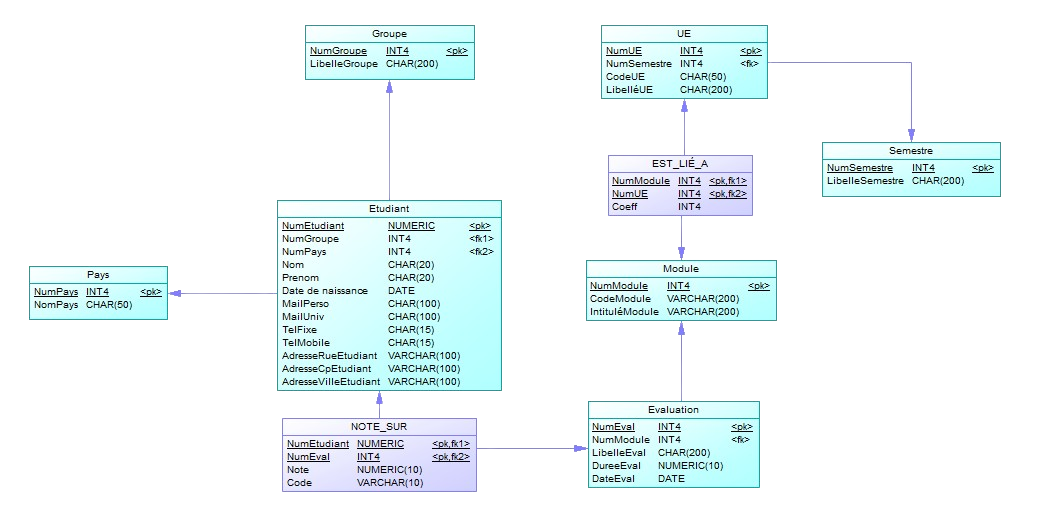
Logical data model. 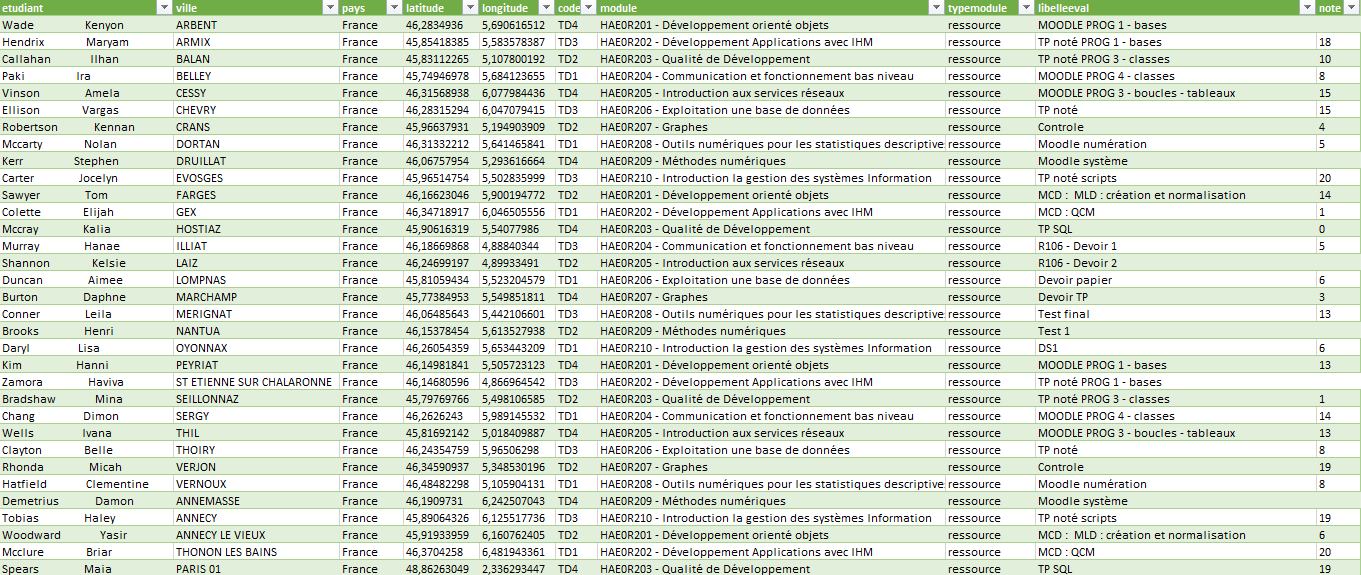
SQL view imported into Excel for calculations. 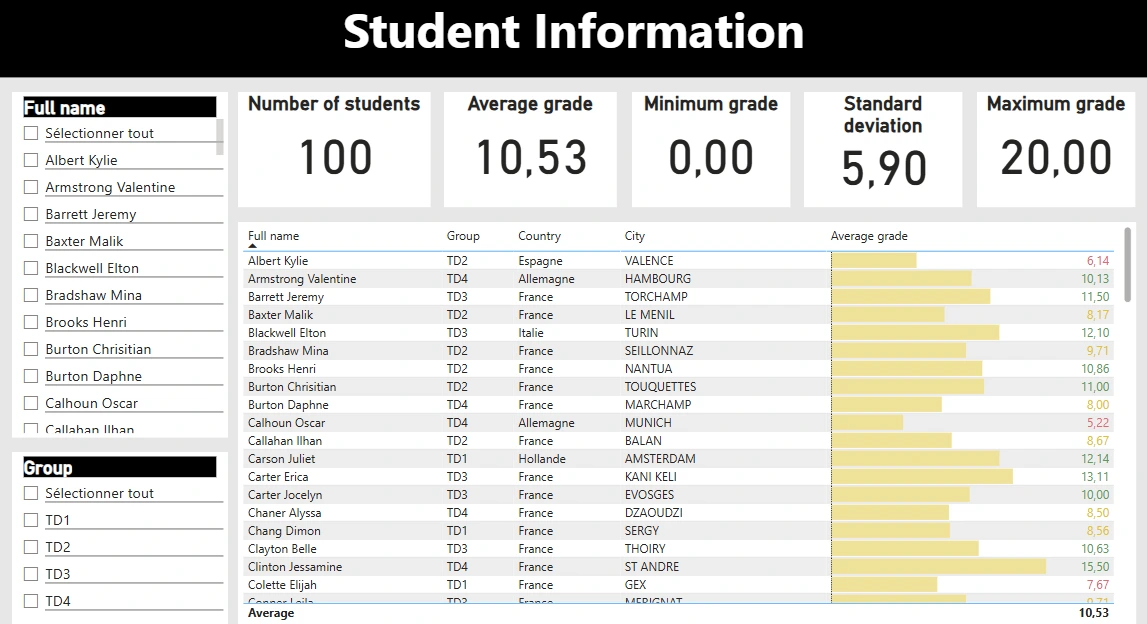
Tracking page for students and their grades. 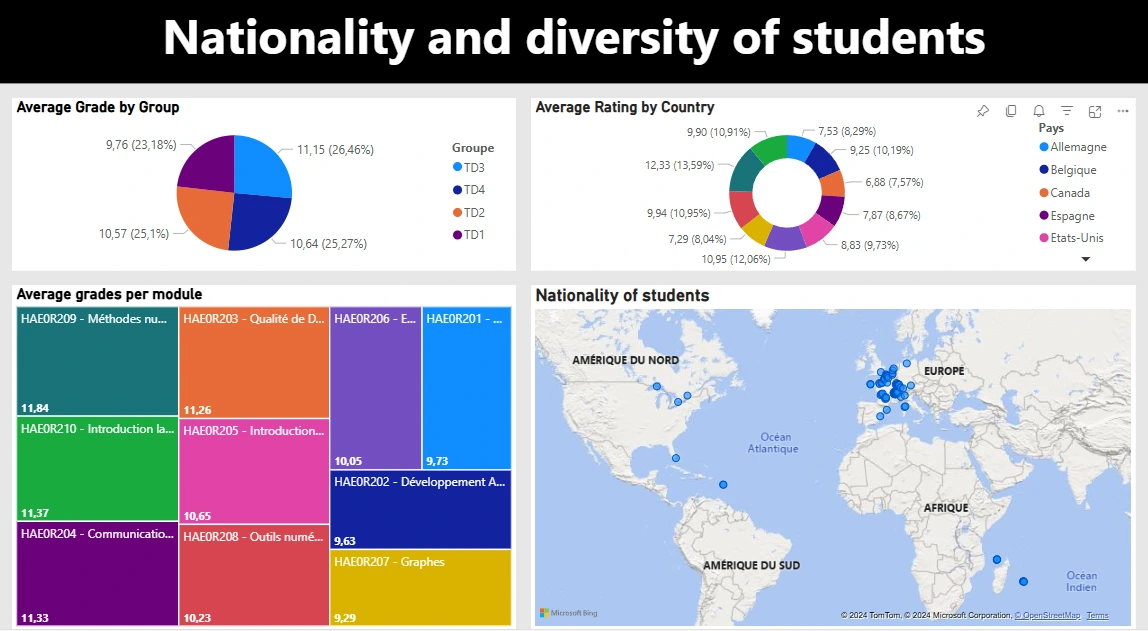
Map page on where students come from.
Facts and figures
- in the database
- 9 tables
- in the data script
- 1,178 inserts
- tracked in the report
- 100 students
- in the Power BI report
- 2 pages
What I took away
The main challenges and lessons came from managing the project and from setting up the initial requirements.