Open Food Facts
From a 326 MB CSV to a decision-support platform: OLTP and OLAP databases on Azure, Knime workflows and Power BI dashboards.
Context
SAE S4.C.01 of the BUT in Computer Science, “development with a database and visualization” (2024-25). The brief was to improve an existing collaborative database, add simulated sales, produce reports and train models able to assign the Nutri-Score despite missing fiber and sodium data.
Team and my role
Group project, 5 people.
I wrote the SQL scripts that keep keys consistent between the two Azure servers, and built the joins, ID matching and required transformations in Knime.
Approach
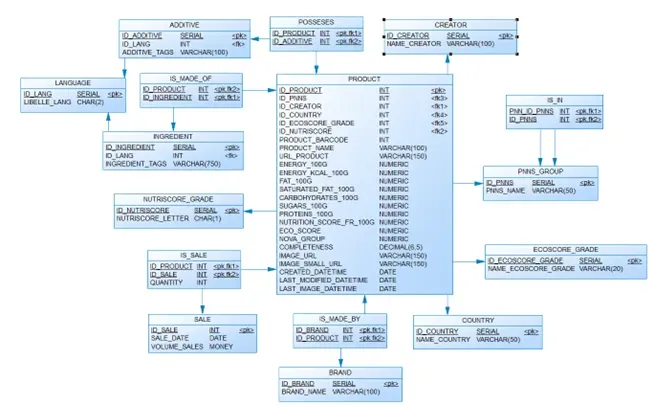
- OLTP database: normalized model on Azure PostgreSQL, with indexes on foreign keys and views dedicated to visualization.
- Simulated sales: Python script generating sales for 1,000 products over 3 years, using Poisson and normal distributions.
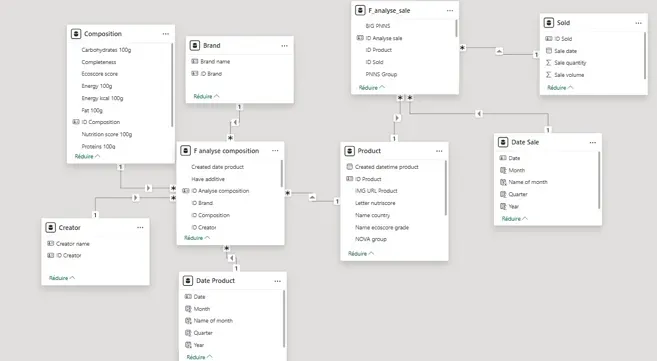
- OLAP database: two fact tables, composition and sales, loaded with Azure Data Factory and Knime.
- Exploration: k-Means and DBSCAN clustering, evaluated with an entropy scorer.
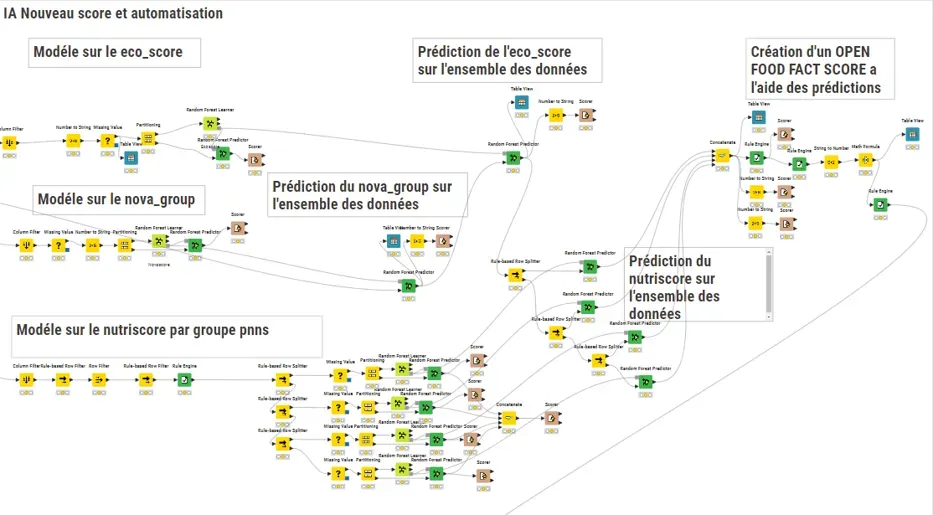
- Models: decision trees then Random Forest, with the best result coming from four models trained per PNNS group.
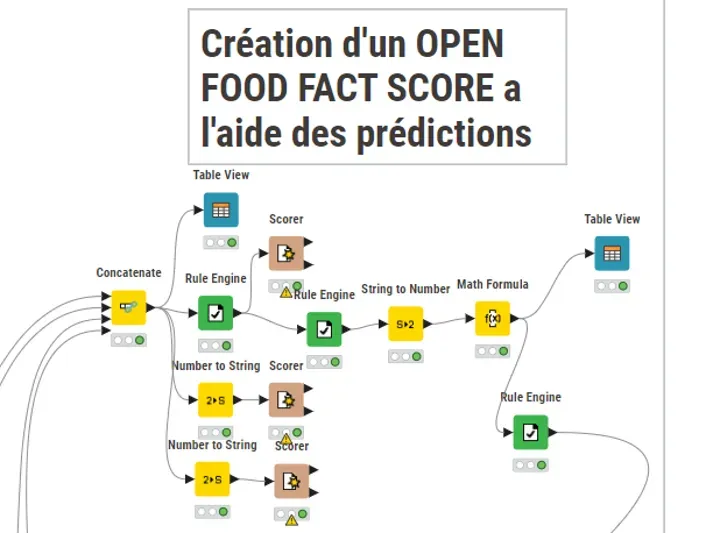
- Composite score: creation of the Open Food Facts Score (OFFS), which adds up Nutri-Score, Nova group and eco-score, then a decision tree to assign it to new products.
- Reporting: two Power BI reports, one on the OLTP model and one on the OLAP model.
Visuals
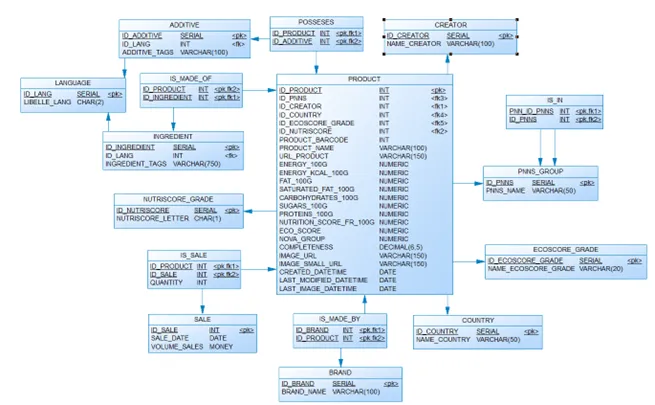
Normalized OLTP model with 16 tables. 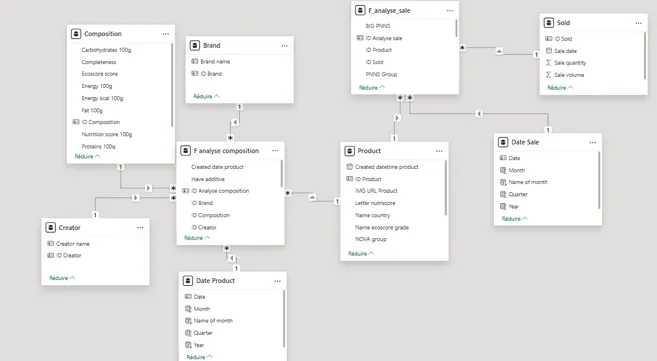
OLAP model with 2 fact tables and 5 dimensions. 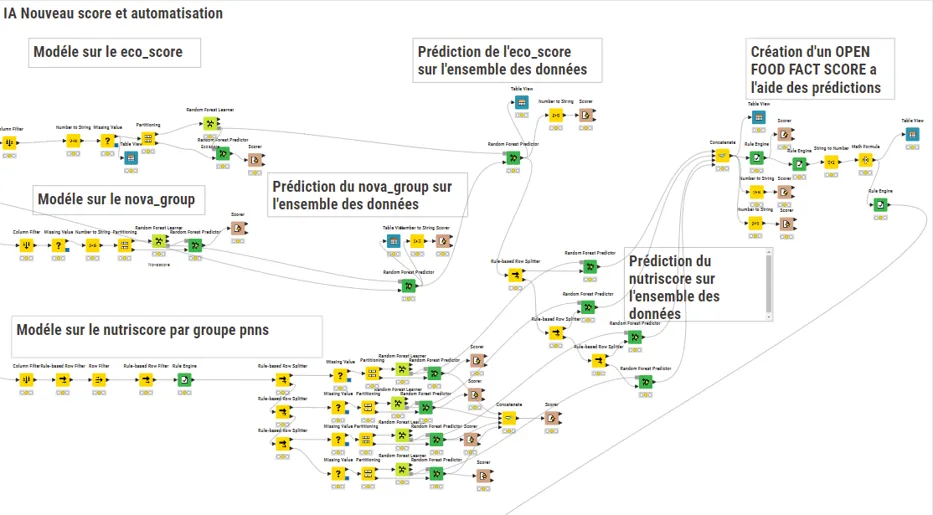
Knime workflow for the three prediction models. 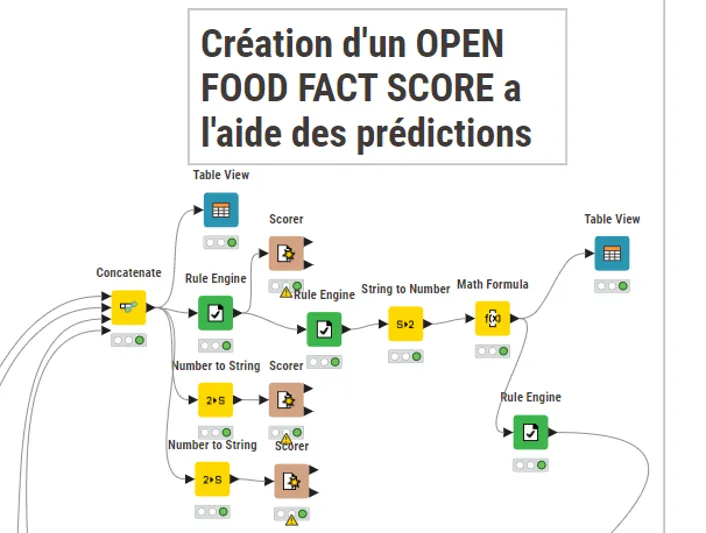
Building the composite score from the predictions.
Facts and figures
- starting Open Food Facts CSV
- 326.6 MB
- OLTP and OLAP models, plus 11 views
- 16 + 7 tables
- of simulated sales over 3 years
- Over 600,000 rows
- overall Nutri-Score precision
- 77%
- precision on eco-score and Nova group, on unseen data
- 85% and 82%
- precision assigning the composite score, on unseen data
- 86%
- OLTP and OLAP Power BI reports
- 4 + 4 pages
What I took away
The main challenges and lessons came from managing the project and from setting up the initial requirements.